General Description
The Euvis FMCC371 module is a high-speed FMC carrier designed as a carrier board for Euvis FMC modules FMC271 and FMC201. The FMCC371 module is equipped with a Xilinx Virtex 6 FPGA XC6VLX130T and a Cypress CY7C68013A micro-controller. The FMCC371 carrier accepts divided clocks from the FMC module and generates 96 pairs of LVDS digital data at up to 1 GSPS. The digital data is fed to the FMC module via two FMC connectors. The maximum memory depth is 512K x 12 bits, corresponding to 64 us of analog waveform at 8 GSPS. The carrier can be controlled by a PC-based GUI via a USB 2.0 interface. Built-in waveforms include sinusoidal, multiple tones, FMCW chirping, and pulses. Coupled with FMC271 and FMC201, the FMCC371 is a versatile, compact arbitrary waveform generator (AWG).
Ordering and Pricing Information
For pricing information, please visit Pricing. For formal quotations, availabilities, and quantity-specific orders, please e-mail info@euvis.com, or call 1-805-583-9888.
Key Features
- 96 pairs of LVDS digital data
- I2C controls to FMC module
- Memory depth: 512K x 12b (Words)
- Two programmable markers
- Continuous, multi-burst, and gate modes
- Accept external trigger in burst mode
- Built-in waveforms, such as sinusoidal, multi-tone, FMCW chirp, and pulses
- USB 2.0 interface
- Companion GUI and API
- Provide +12 and +3.3 V power supplies to FMC module
- +12 V with AC adapter included
- VITA 57.1 standard compliant
Applications
The FMCC371 module can generate arbitrary high-speed digital data to FMC modules.
- Orthogonal Frequency Division Multiplexing (OFDM) transmitter
- Optical OFDM transmitter
- Ultra-Wideband transmitter
- Linear Frequency Modulation (LFM) and chirping
- Frequency Modulated Continuous-wave radar (FMCW)
- Electronic warfare
- VSAT satellite communications
- Test and measurement equipment
Module Photo:

Functional Block Diagram

Functional Specifications
| Front-End Input Clock | |
| Type | From FMC |
| Frequency Range | 125 ~ 500 MHz |
| Divide Ratio | 1/2 of Digital Data Rate |
| Logic | LVDS |
| Digital Data Inputs | |
| Sampling Rate | 250 ~ 1000 MSPS |
| Connector | FMC High-Pin Count (HPC) and Low-Pin Count (LPC) |
| Logic | LVDS |
| Data Width | 96 pairs |
| DAC Control | |
| DAC Reset | FMC, LVDS Pairs |
| DAC Return-to-Zero Mode Select | FMC, LVCOMS25 |
| DAC Amplitude Control | FMC, I2C |
| DAC Sampling Window Select | FMC, LVCOMS25 |
| Clock Buffer Control | |
| Clock Amplitude | FMC, I2C |
| Clock Duty Cycle | FMC, I2C |
| DC Supplies | |
| + 12V | 4 A |
| + 3.3V | 5 A |
Board Dimensions

| Dimension (mm) | |||||
| Width | 233.4 | Height | 160 | ||
Test Setup
In applications, FMCC371 provides a VITA 57.1-compliant double-width module board:
digital data, DAC controls, I2C signals, and DC power via FMC connectors. The
carrier is capable to provide both +12V and +3.3V power with current capacities of 2A and 500mA respectively.
Digital data and DAC resets are in LVDS pairs.
The DAC sampling window selects and return-to-zero mode select are single-ended LVCMOS25.
The following photo shows FMC module is plugged and tested with FMCC371.
In the test setup, the carrier is controlled by a PC host via the USB interface.
The carrier can store up to 512K words of data in memory.
The maximum data length is 64 μs at 8 GSPS or 64 us for two channels at 4 GSPS.
Several built-in waveforms are available within the FMC GUI.
Waveform generation and download are performed in the GUI.
Several examples of built-in waveforms available for use are shown below.

|

|

|
Waveform Generation Examples
Sinusoidal
|
|
|

|
||
|
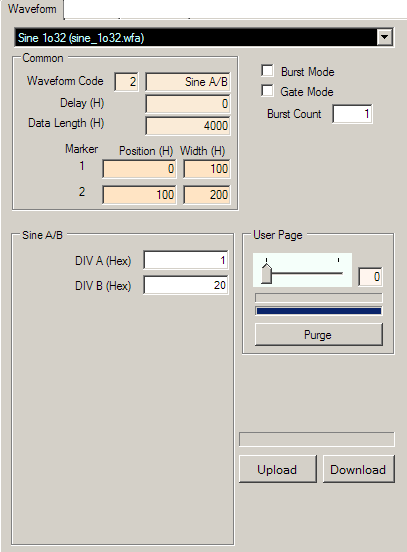
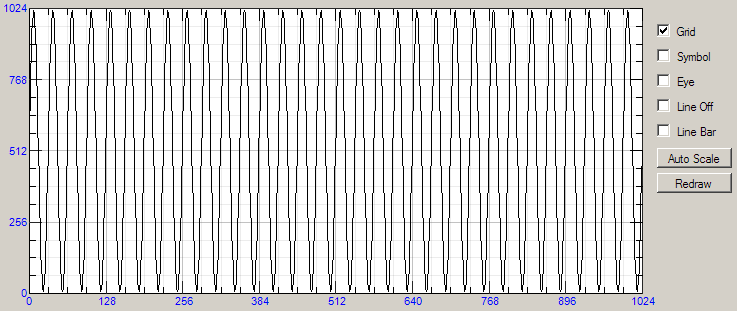
The SinA/B waveform style (waveform code 2) is a built-in waveform that creates a sine wave with frequency equal to the sampling frequency scaled by the ratio A/B. The numerator, A, and the denominator, B, must be nonzero unsigned hexadecimal integers. In the left figure above, a sine wave at 1/32 of the sampling clock frequency has been selected using the Euvis GUI, corresponding to A and B values of 0x01 and 0x20 respectively. In the top right figure, the time series of the sinusiod is shown with time series index on the x-axis and amplitude on the y-axis. In the bottom right figure, the FFT of the sinusoid is shown with frequency index relative to the sampling frequency on the x-axis and relative magnitude in dBFS on the y-axis. |
||
LFM Chirp
|

|
|

|
||
|
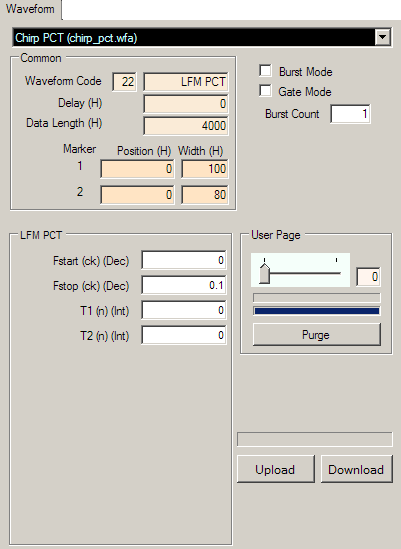
The LFM PCT (linear frequency modulation phase continuous) chirp waveform style (waveform code 22) is a built-in waveform that creates a chirping waveform with the following parameters: · Fstart: the starting chirp frequency as a fraction of the input clock frequency (decimal < 1). · Fstop: the stopping chirp frequency as a fraction of the input clock frequency (decimal < 1). · T1: Time delay before the beginning of the chirp in number of samples. The output frequency will remain at the frequency given by Fstart for T1 samples. · T2: time delay after the end of the chirp in number of samples. The output frequency will remain at the frequency given by Fstop for T2 samples. In the left figure above, a LFM chirp waveform from DC to 1/10th of the sampling clock frequency has been selected using the Euvis GUI, corresponding to Fstart and Fstop vales of 0 and 0.1 respectively. In the top right figure, the time series of the chirp is shown with time series index on the x-axis and amplitude on the y-axis. In the bottom right figure, the FFT of the chirp is shown with frequency index relative to the sampling frequency on the x-axis and relative magnitude in dBFS on the y-axis. |
||
Pulse
|
|
|

|
||
|
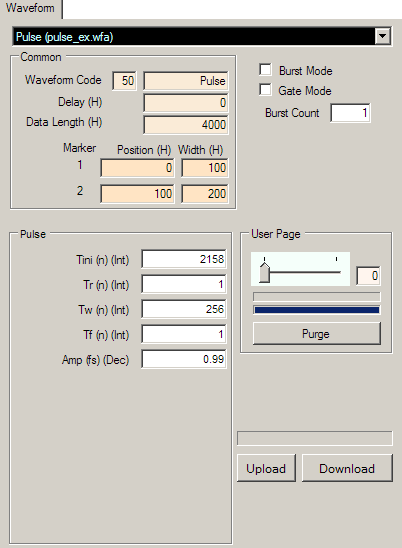
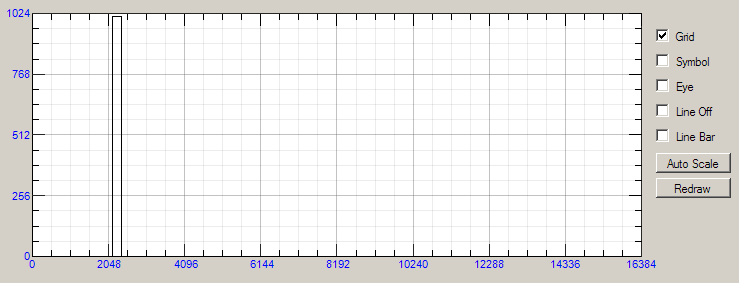
The pulse waveform style (waveform code 50) is a built-in waveform that creates a pulse waveform with the following parameters: · Tini: the start time of the pulse in number of samples (integer). · Tr: the rise time of the pulse in number of samples (integer). · Tw: the width of the pulse in number of samples (integer). · Tf: the fall time of the pulse in number of samples (integer). · Amp: the amplitdue of the pulse relative to full scale (decimal <= 1). In the left figure above, a 256-sample wide pulse beginning at sample 2158 with amplitude of 99% of full scale has been selected using the Euvis GUI. The Tini, Tw, and Amp parameters are 2158, 256, and 0.99 respectively while the others are 1. In the top right figure, the time series of the pulse is shown with time series index on the x-axis and amplitude on the y-axis. In the bottom right figure, the FFT of the pulse is shown with frequency index relative to the sampling frequency on the x-axis and relative magnitude in dBFS on the y-axis. |
||
